Provincial Quality Indicators in Ontario LTC — CIHI CCRS Data Interpretation
Ontario long-term care homes lose decades of comparable performance data in a system transition.

CIHI decommissioned the Continuing Care Reporting System in March 2026, and this closed out a data series that ran from the 2003-2004 fiscal year through 2025-2026, with no further releases to follow. This is not a software update sitting on top of the same numbers. The instrument that generated the data, the pipeline that carried it to CIHI, and the pool of facilities a given home was measured against are all changing at once, under the Integrated interRAI Reporting System. A facility that opens its next quality indicator report and reads it the way it read the last twenty years of CCRS output is comparing two things that were never built to line up. CIHI frames the move to IRRS as a response to stakeholder interest and a step toward more comparable, more actionable data across the care continuum, and that rationale is sound. The immediate effect on an Ontario home trying to track its own performance this year is disruption to whatever multi-year trend it had been watching.
What CCRS measured and how its quality indicators were structured
CCRS was never just a thin layer of reporting metrics sitting on top of care delivery. Its quality indicators were drawn from a standardized clinical assessment, the RAI-MDS 2.0 instrument, that captured more than 500 data elements per resident, and the resulting indicators were risk-adjusted so that homes with different resident populations could still be compared on fair terms. CIHI's own CCRS metadata lists the breadth of what that assessment covered: cognitive function, vision, psychosocial well-being, continence, health conditions, skin condition, treatments and procedures, communication and hearing, mood and behaviour, physical function, disease diagnosis, nutritional and oral status, and activity patterns. Those elements did double duty. They fed direct clinical care planning for the resident in front of a nurse, and they also fed the system-level reporting that eventually became a facility's public indicator results.
The RAI-MDS 2.0 instrument didn't stop at raw data collection. It automatically generated Clinical Assessment Protocols that clinicians used to flag risk and plan care, outcome scales summarizing cognition, physical function, and frailty or instability, the RUG-III case mix methodology, and the risk-adjusted quality indicators themselves. Every indicator a facility saw in a CIHI report was a downstream product of that larger assessment structure, not a number collected on its own. The clinical data standards behind this entire architecture were developed by interRAI, an international research network, and adapted with its permission for use in Canada. Ontario's participation in CCRS spanned both hospital continuing care and residential long-term care, which gave the province a data pool large enough to support benchmarking that meant something statistically, not just administratively.
The risk-adjustment piece is what made cross-facility comparison defensible in the first place, because without it, a home serving a frailer, more cognitively impaired population would always look worse on raw numbers than a home serving a healthier one, regardless of the actual quality of care delivered. Risk adjustment controlled for those population differences so that a facility's indicator result reflected something closer to care quality. That adjustment was calibrated to the RAI-MDS 2.0 instrument and the specific population of homes submitting to CCRS. If the instrument or the population changes, the calibration doesn't automatically carry over.
How benchmarking logic worked under CCRS
A result on a CCRS quality indicator was never a standalone score. It was a position, measured against a national average, and that position carried a specific statistical meaning tied to the RAI-MDS 2.0 instrument and the group of facilities submitting data at the time. CIHI's indicator page for Improved Physical Functioning in Long-Term Care spells out how that classification worked. If a facility saw an upward green arrow, its result was statistically better than the national average. A blue tilde meant the result was not statistically different from the national average, the "same as average" classification. A downward pink arrow meant the result was statistically worse. Trend arrows layered on top of that, marking whether a facility was improving, holding steady, or weakening over time, a separate statistical judgment from the single-point comparison against the national figure.
For long-term care organizations, that reference point was always a national average, not a peer group average the way hospitals are compared. An Ontario home's result sat against every participating Canadian LTC facility submitting to the same system, not against a narrower subset of comparable homes. CIHI also distinguished between established indicators, which used the full statistical test described above, and non-performance-based or newer indicators, which judged higher or lower than average purely by numerical difference, without the same directional statistical rigor. The "top results" designation added another layer of discipline: a facility only earned that label by appearing in the top tier for three consecutive years, not by posting one strong year and coasting on it. Trend stability was built into what counted as genuinely excellent performance.
That structure means the transition creates a problem that has nothing to do with how any given home is actually caring for its residents. Because IRRS draws on a different instrument and potentially a different set of participating organizations, a facility that sat comfortably in the "same as average" blue tilde category under CCRS could land somewhere else entirely under IRRS without changing a single clinical practice if the reference pool shifts. The number moves. The care doesn't.
Structural Changes as IRRS Replaces CCRS
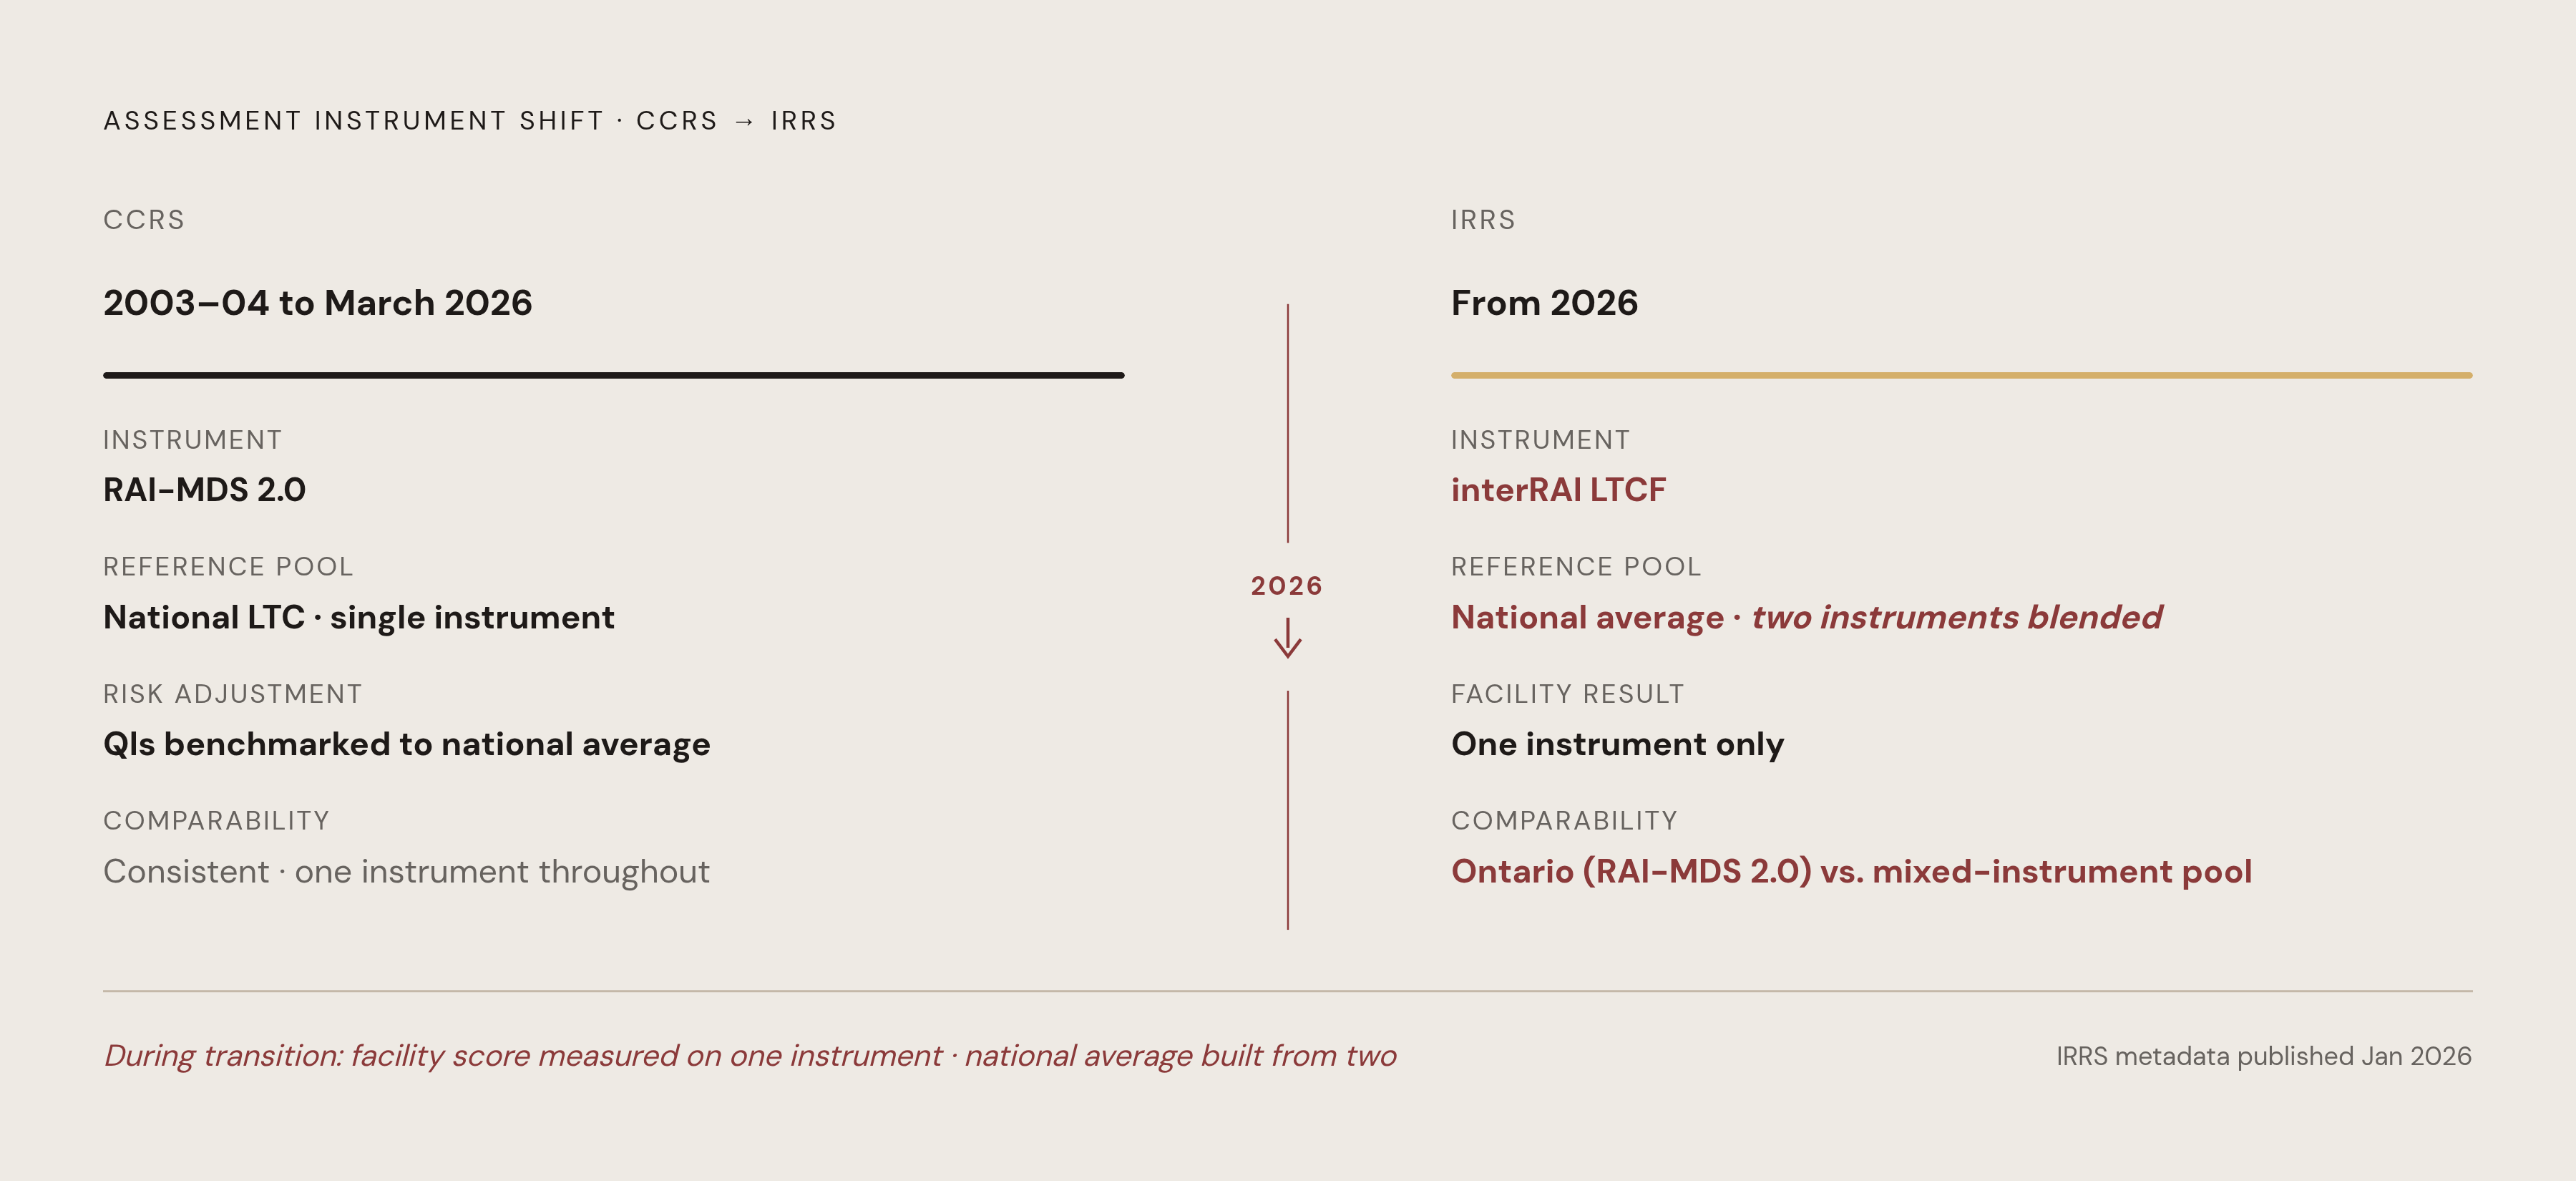
IRRS is not CCRS wearing a new label. It draws on a different assessment instrument, interRAI's LTCF tool, rather than RAI-MDS 2.0, and that means the data elements feeding every quality indicator are structurally different from what fed CCRS. CIHI states the distinction without ambiguity on its data holdings page: CCRS accepted information built on interRAI's RAI-MDS 2.0, while IRRS accepts information built on interRAI's LTCF instrument. IRRS carries demographic, administrative, clinical, and resource utilization information on people receiving long-term care, and participating organizations still supply facility characteristics to support comparative reporting and benchmarking. The architecture looks parallel to what came before, but it draws on a different assessment instrument, producing structurally different data elements underneath.
CIHI's own methodology notes for the transition period already acknowledge the complication directly. Canada-level results blend data from both interRAI LTCF and RAI-MDS 2.0 submissions. Results for individual provinces, regions, corporations, and facilities are based on a single instrument only. That means a national average and a facility-level result are, for the time being, not built on a common instrument basis. Concretely, Ontario's results for the 2024-2025 period rest on RAI-MDS 2.0, while Nova Scotia, New Brunswick, and Saskatchewan results for the same period rest on interRAI LTCF. If an Ontario facility checks its position against the national average, it is being measured against a reference pool that mixes two different assessment instruments at once.
The historical trend comparison is where this does the most damage. A home trying to determine whether its fall rate has dropped over five years, or whether its physical functioning indicator has genuinely improved, now has to bridge across two different assessment instruments and two different reporting systems, with no guarantee of a direct crosswalk between them. CIHI published its IRRS metadata only in January 2026. The documentation for the new system is still new, and facilities are early in the process of learning its specifications well enough to interpret results with confidence.
What the quality indicators cover and why the clinical domains measured affect facility risk exposure
The domains covered by these indicators sit at the center of both resident welfare and regulatory exposure: safety, physical and cognitive function, and quality of life. CIHI's safety, well-being, and staffing insights for 2024-2025 show what that looks like in practice. Antipsychotic medication use without a diagnosis of psychosis is tracked because those drugs carry real risks, including adverse reactions, cognitive decline, falls, and premature death. Falls in the period before assessment are tracked, and elevated risk is flagged for residents living with dementia or a prior hip fracture. Social engagement, meaning whether residents take part in activities or interact with the people around them, is tracked as its own measure. Hospital transfers at the end of life, specifically residents who die shortly after being transferred to hospital, round out the picture.
Physical functioning gets split into two separate indicators, one tracking improvement and one tracking worsening, reflecting a basic clinical reality in the interRAI framework: helping a resident maintain function and helping a resident recover function are different goals that call for different interventions. This population skews older, with significant physical and cognitive difficulties including frailty and dementia, and a meaningful share of residents nearing the end of life. That acuity context is why risk adjustment carries so much weight. Without it, indicators would penalize homes simply for serving a sicker population rather than measuring the quality of care those residents receive.
None of these domains were picked at random. Antipsychotic use, falls, and physical deterioration are the same categories an Ontario inspector walks in the door looking for. A facility's quality indicator results function as an early read on regulatory vulnerability, well before any inspector arrives, because the indicators and the inspection checklist are examining the same clinical ground.
How Ontario's inspection and accountability environment amplifies the stakes of misreading indicator trends
Ontario's inspection regime, set up under the Fixing Long-Term Care Act, 2021, requires homes to run continuous quality improvement initiatives and to post their results publicly. Quality indicator data is a published accountability record that inspectors, residents' families, and the public can all look at. The same legislation set a staffing target that shapes the operating conditions under which all of this data gets generated: a system-level average of four hours of direct care per resident per day from registered nurses, registered practical nurses, and personal support workers combined, a target Ontario was required to hit by March 31, 2025, and sustain every year after.
The inspection infrastructure itself is in motion alongside the data infrastructure. The Compliance Assistance and Regulatory Enforcement System that inspectors use was being modernized as of summer 2025, with parallel updates to the public reporting portal, LTCHomes.net. The tools surveyors rely on are shifting at roughly the same time as the underlying data pipeline that feeds them.
Misreading a result under these conditions can cut in either direction, and both are costly. A facility might see a worsened indicator under IRRS and dismiss it as noise from the instrument change, when the number is actually flagging a genuine decline in resident care. Or a facility might see a stable-looking result and conclude nothing has changed, when a real problem is developing against a new baseline that masks it. Neither error is harmless in a system where the results are posted publicly and inspectors are watching the same trends. The only posture that holds up against this kind of benchmark instability is continuous, predictive monitoring of a facility's own indicator trends in near real time, rather than treating indicator data as something to review retrospectively before the next survey. Watching direction of change, rather than leaning on a single fixed reference point, is what survives a transition like this one.
Approaching Quality Indicator Data During the Transition
The sound response to a shaky benchmark is to change the question being asked of the data rather than stop trusting it. Instead of asking whether a facility sits above or below the current national average, the more useful approach during this transition is to track whether resident outcomes are moving in the right direction over time, measured against the facility's own history rather than against a reference pool that is mixing two instruments.
IRRS's Secure Reporting tool lets organizations explore their own data and track trends over time, and that internal view is the most defensible analytical ground available right now, because a facility's own longitudinal trend isn't distorted by the instrument and reference-pool shifts that make cross-facility comparison unreliable during the transition. CIHI says IRRS supports Clinical Assessment Protocols that identify risk and guide care planning, and it has near real-time data validation built in. The system was designed to inform front-line clinical decisions as they happen, as well as to produce a report months after the fact.
Facility teams need to know, concretely, which instrument underlies their current submissions. Ontario's IRRS results for the present transition period are based on RAI-MDS 2.0, even as the system as a whole moves toward interRAI LTCF, and CIHI's methodology notes spell out that distinction for anyone reading results at the provincial or facility level. Checking which instrument a given result rests on, before drawing any conclusion about performance, is now a basic step in reading the data correctly.
The clinical domains worth watching continuously are antipsychotic use, falls, physical functioning, social engagement, and hospital transfers at the end of life, the same domains the quality indicators already cover. The indicator framework and the clinical risk agenda point at the same signals. A facility already has much of what it needs to manage resident risk in the clinical documentation nurses produce every shift. The work is surfacing that information continuously, rather than waiting for the next CIHI release or the next inspection, and keeping that ongoing internal monitoring lined up with the quality indicator framework, so the same signals show up whether the audience is an internal care team or an external regulator reading the public record.